


Booming Prices on the European Emission Trading System: From Market Oversupply to Carbon Bubble? Edito Energie, October 2018
Since its creation in 2005, the European emission trading system (EU ETS) has been through several periods of turmoil. With emission allowances (EUA) averaging around 7 euros per ton from 2012 to 2017, European Member States have been trying to remedy the depressed price signals successively through market design reforms at both European level (backloading, market stability reserve) and national level, with the UK introducing a carbon price floor for its domestic power sector in 2013.
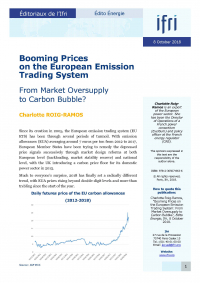
Much to everyone’s surprise, 2018 has finally set a radically different trend, with EUA prices rising beyond double-digit levels and more than trebling since the start of the year.
Market design reforms have finally restored the credibility of the EU carbon market
Several factors explain the steep rise in carbon prices since 2018, detailed here by decreasing order of impact on the market:
- The entry into force of the revised EU ETS Directive[1] in April 2018 has certainly increased credibility of the scheme after three years of thorough negotiations. The new rules for Phase 4 (2021-2030) will contribute to reducing the current surplus of emission quotas on the market thanks to: 1) a stronger decline in the annual emission cap from -1.74% to -2.2% and 2) the reinforcement of the market stability reserve rules (MSR, see below).
- As part of the reform package, the anticipation of the start of the MSR in January 2019 is undoubtedly the most important factor behind the price surge. Following the new rules of the game, 24% of remaining allowances should be placed in the reserve on a yearly basis from 2019 to 2023 (and 12% thereafter), provided allowances in circulation exceed 833 million tons.[2] In the current market context, 265 million allowances should therefore be taken off the market and placed in the MSR over the first eight months of 2019.[3] Looking beyond, the MSR should enable the reduction of up to 70% of quotas in circulation by 2023.
- The heatwave during the 2018 summer period has also reduced production from low-carbon generation facilities across the EU,[4] in favor of more polluting conventional thermal generation, which in turn increased demand for emission quotas.
- Likewise, the steady increase in industrial output in the EU since January 2017[5] has logically implied a rise in demand for quotas and contributed to the perception of a tightening market.
Beyond these market fundamentals, the price surge is also strongly encouraged by speculation from market players who are taking long positions on the EU ETS market, in anticipation of further increases in CO2 prices. As a reminder, financial market players do not need to return emission quotas at the end of the compliance year on April 30th, however their bullish behavior on the market further reduces supply of allowances available for EU industrial consumers which in turn pushes prices upwards. In addition, with prices expected to keep rising, utilities are encouraged to stockpile allowances as a protection against future volatility.
With current prices around 20-25 euros per ton even before the implementation of the MSR, most analysts have reviewed their figures and estimate the carbon price will reach 35 to 40 euros per ton in 2023. This begs the question as to whether a new balance has been reached in the EU ETS and whether the rise is fully justified by fundamentals, or if we are witnessing a bubble.
Yet, the EU carbon market is still not doing its job in the power sector
As a reminder, the EU ETS is an emissions cap-and-trade system englobing more than 11,000 of the heaviest polluting consumers across Europe (energy and industrial consumers as well as aviation), covering around 50% of European CO2 emissions and 40% of greenhouse gas emissions (GHG). The four phases of the scheme are designed to gradually increase the pace of emission cuts for the different sectors by progressively squeezing market supply for emission allowances.
Following the recent reforms, with a faster reduction of the annual emission cap, the MSR kicking in and a strong increase in allowance prices, consumers under the EU ETS are expected to either reduce their GHG emissions through low-carbon investments or to buy extra emission credits to compensate for their pollution excess. In particular, a switch from electricity produced by high-emitting sources to electricity produced by lower-emitting sources is anticipated from energy producers, leading to the progressive reduction of power production from coal and lignite sources in favour of gas and renewable sources.
However, if we look into the evolution of clean dark spread and clean spark spread[6] curves in recent months, which calculate the theoretical margins of coal and gas producers respectively after taking into account the new cost of CO2 emissions, it seems that both curves have neither converged nor switched across Europe, meaning that it remains cheaper to produce power from coal rather than switching to gas. In Germany for instance, clean dark and spark spreads are both in negative territory for modern coal-fired and gas-fired plants
(-2 euros/MWh and -11 euros/MWh respectively in April 2018).
In fact, external factors to the EU ETS need to be taken into account to explain why a switch from coal to gas sources has not happened yet: the clean spark spread remains less competitive because of recent increases in gas prices, in turn due to very low gas storage levels in Europe following the cold winter 2017/2018 and to competition from Asia on Liquefied Natural Gas tenders, and to the current increase in commodity prices. Moreover, improved thermal efficiency rates for coal-fired plants in some countries make it more difficult to compete with (e.g. three highly efficient plants in the Netherlands, commissioned in 2013).
Therefore, even in an environment where CO2 prices have trebled in the past nine months, the EU ETS still does not seem to incentivize a shift to low-carbon energy production sources, as CO2 prices are too low to compensate for other energy factors. In the current context, most analysts estimate that a price of around 40 to 50 euros per ton is the equilibrium point for CO2 for a switch from coal to gas to happen. The switch in fuel sources would happen first in Germany, Italy, the Netherlands and Spain due to their respective energy mixes and the efficiency rates of their respective power plants.
Implications for the carbon price floor debates
One could argue that although current carbon price levels are still too low to ensure a switch of power generation from coal to gas across Europe, a switch could happen over a three to four-year horizon. However, the bubble can still burst at any time and several factors contribute to a lack of visibility on the EU ETS going forwards:
- The market has been experiencing strong volatility. For instance, the price surge at 25,2 euros per ton on 10th September was followed by a price decrease to 18,9 euros per ton on 13th September. This price drop by 25% within four days was mostly the result of a call from the Polish government to the European Commission to intervene to stop the EUA price rise.
- Price variations resulting from institutional or governmental announcements are frequent in the EU ETS and create renewed concern regarding the price volatility risk of the scheme. Here, Article 29a of the EU ETS Directive provides for the possibility of convening a meeting at EU level in the case of excessive price fluctuations. However, at present relevant conditions do not seem to be met.
- This also highlights the highly financialized nature of the EU ETS and its potential price runaway incidents, for instance during the financial crisis in 2008.
- A lack of visibility from 2024, due to energy market fundamentals shifting. Indeed, a decrease in the cost of renewable energy and storage technology in the next six years could favour power production through less polluting sources or encourage Member States to increase their renewables mandates, meaning that there will be less interest in CO2 allowances, which in turn would decrease demand for quotas and depreciate EUA prices. Thus, the low carbon transition would be dealt with outside of the market.
In sum, even under the right CO2 price conditions, uncertainty and risk of rapid market shifts in the EU ETS remain a strong obstacle to low-carbon generation investments across Europe. In this context, national measures may still appear as the only way of guaranteeing the fuel switch going forward.
For several years, discussions around setting carbon price floors across Europe have taken place in order to foster greater emission reduction targets and an effective fuel switch from coal to gas, thereby adding another layer of market design to the EU ETS:
- The UK has set a carbon floor increasing from 15,70 pounds in 2013 to 70 pounds in 2030.
- The Netherlands are currently considering putting in place a carbon floor to increase from 18 euros in 2020 to 43 euros in 2030.
- France has been discussing about setting a carbon price floor since 2016, yet it is looking into establishing a regional initiative in order to avoid carbon leakage.
- Germany is currently in the midst of political debates regarding the future of its 46 GW coal-fired capacity (i.e. 37% power generation in 2017). A coal phase out plan is currently being elaborated by an independent commission, with announcements scheduled for the end of 2018.
Carbon floors can bring a more stable solution, however they come with several disadvantages, the main one being competition distortion across the EU by shifting carbon emissions from one country to another if the scope of application is set nationally and ignores the option of importing power from neighbouring countries via interconnectors. In an increasingly interconnected network, only EU-wide or at least regional approaches are effective. Besides, the net environmental benefit carbon price floors is also disputable at present. Without an incentive to voluntarily cancel allowances at national level, carbon price floors may fall short of reducing emissions at European level.
Finally, although carbon price floors have come as an evolution to turn the European emissions market design into a more stable and foreseeable system, they cannot carry out fuel switching in the short term unless they are set at a sufficiently high level (40-50€/ton), which is probably inconceivable in terms of social acceptance. Carbon price floors are politically sensitive because they can be considered as additional taxation for final electricity consumers, and a coal phase-out requires extensive economic and social negotiations and adjustments. Therefore, a sound combination between administrative closures and regional commitments on carbon price levels are needed to ensure a workable and cost-efficient decarbonization of the power sector.
[1]. Directive (EU) 2018/410.
[2]. The MSR rules provide that between 2019 and 2023, 24% of quotas are placed in the reserve as long as the number of surplus allowances exceeds 833 million tons, and that 100 million tons are released from the reserve via auctions if the surplus becomes inferior to 400 million tons.
[3]. European Commission, “ETS Market Stability Reserve will start by reducing auction volume by almost 265 million allowances over the first 8 months of 2019”, Press release, May 15th, 2018, available at : https://ec.europa.eu.
[4]. France reduced its nuclear power generation, Scandinavia lowered its hydro generation levels and Germany lowered its wind production levels.
[5]. Eurostat industrial index, available at: https://ec.europa.eu.
[6]. Clean spark spread (CSS) and clean dark spreads (CDS) are a function of market prices, carbon emission factors and energy efficiency rates: CSS = Electricity price – (gas efficiency factor x gas price + gas emission factor x carbon price); CDS = Electricity price – (coal efficiency factor x coal price + coal emission factor x carbon price).